Original research · snapshot 2026-08-26
State of Small Business Websites 2026. 11,432 domains measured.
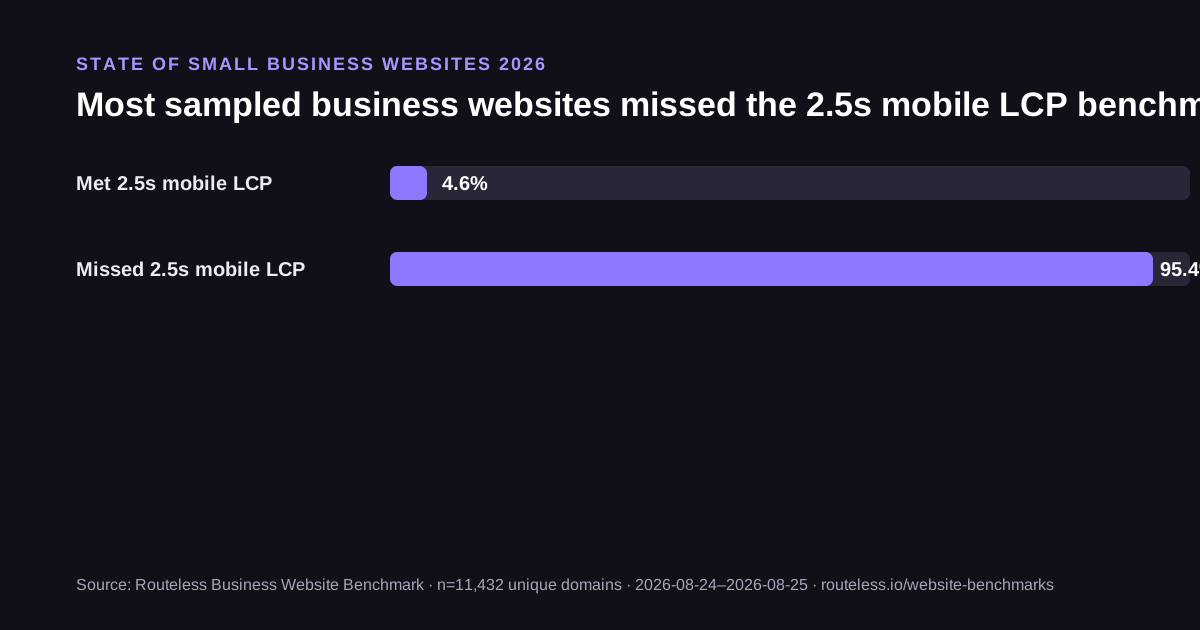
Routeless tested live business homepages across 327 cities in 43 states. The median mobile LCP was 7.9 seconds, and 95.4% of completed tests missed the 2.5-second benchmark. These are measured lab results from the sampled sites, not estimates or claims about every US business.
- 11,432 unique domains after deduplication
- 11,184 successful mobile PageSpeed runs
- 327 US cities represented in the snapshot
Your website
Turn the benchmark into priorities.
Get an expert review of the performance, conversion, and technical fixes worth doing first.
Get my free review
Audit the report
Check the data and method.
Review the immutable snapshot, denominators, metric version, and public downloads.
See the methodology
Executive findings
Mobile lab test · n=11,184
95.4%
Homepage scan · n=11,432
63.1%
Homepage scan · n=11,432
29.6%
Homepage scan · n=11,432
8.4%
Four findings define the national snapshot.
Each figure below identifies the instrument and valid sample. The sections that follow explain what the result does and does not support.
had no detectable contact form
Review homepage signalshad no detectable analytics tag
Review homepage signalshad detectable online booking
Review homepage signalsDetection is based on machine-readable homepage evidence and can miss tools loaded through an unknown implementation. Performance is a mobile Lighthouse lab measure, not field data.
Finding 01 · mobile speed
95.4% of tested sites missed the 2.5-second LCP benchmark
Largest Contentful Paint measures when the largest visible element finishes rendering. Google calls 2.5 seconds or less “good.” The median in this sample was 7.9 seconds. That is a Lighthouse lab result for the 11,184 sites that completed a run; field performance varies by device, network, and visitor.
2.5sgood boundary
7.9ssample median
0s5s10s+
Routeless Website Benchmark • n=11,184 • 2026-08. This is mobile Lighthouse lab LCP for completed PageSpeed runs, not field performance for every visitor.
Homepage signals
A website can load and still leave the next step unclear.
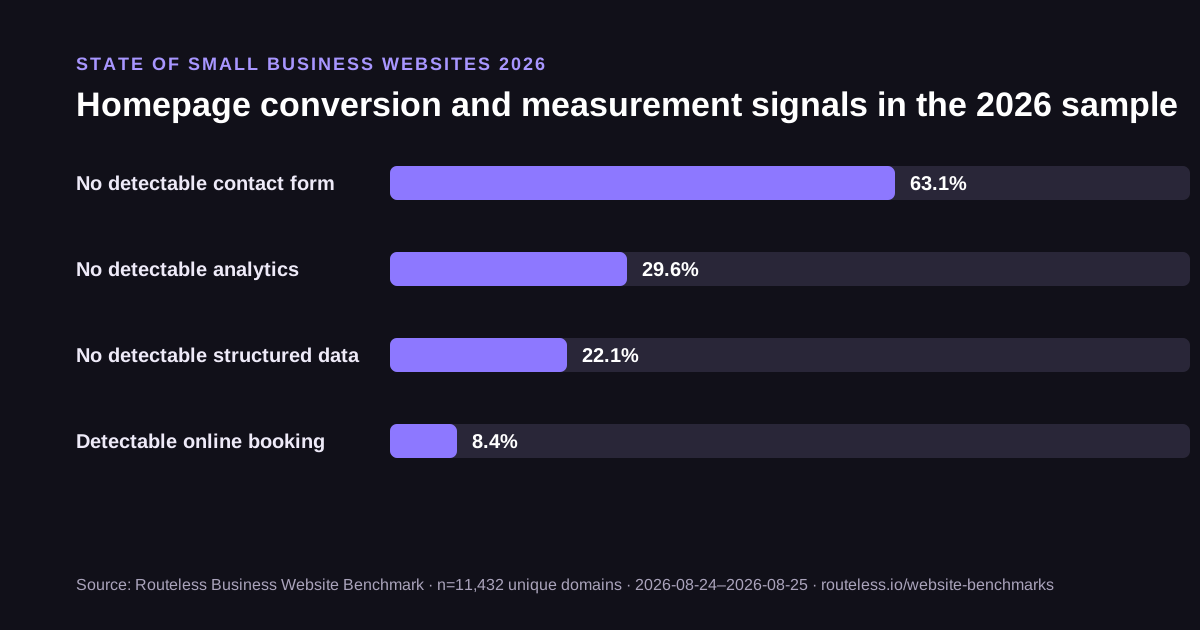
We fetched each live homepage and looked for a short list of machine-detectable conversion and measurement signals. “Not detected” is deliberately narrower than “does not exist”: a form or analytics system hidden behind an unknown script may escape the detector.
No detectable contact form
63.1%n=11,432 valid homepage observations
No detectable analytics tag
29.6%n=11,432 valid homepage observations
No detectable structured data
22.1%n=11,432 valid homepage observations
Detectable online booking
8.4%n=11,432 valid homepage observations
Source: Routeless Website Benchmark · collected 2026-08-24 through 2026-08-25.
Platform comparison
WordPress and Wix had different distributions in this sample.
We detected 5,923 WordPress sites and 654 Wix sites. The platform comparison reports what appeared in this observational sample. It does not prove that choosing a CMS causes a specific speed or conversion result.
Metric
WordPress
Wix
Audited domains
5,923
654
Median mobile score
59
65
Median lab LCP
8.7s
6.9s
Contact form detected
41.0%
31.3%
Inspect WordPress vs. Wix with the full denominators →
Planning a rebuild? Compare the 2026 website cost tiers →
Industry breakdowns
n=3,697
n=3,776
n=297
n=1,128
4 industry cohorts cleared the publication threshold.
Industry pages publish only when the latest snapshot contains enough valid observations. Smaller cohorts remain in the dataset pipeline rather than being presented as stable comparisons.
Dental websites
Median mobile LCP: 8.7s. Detectable contact form: 28.0%.
Law firm websites
Median mobile LCP: 7.3s. Detectable contact form: 48.3%.
HVAC websites
Median mobile LCP: 8.1s. Detectable contact form: 36.7%.
Plumbing websites
Median mobile LCP: 7.1s. Detectable contact form: 40.6%.
State and regional breakdowns
7.9s
8.3s
8.1s
7.7s
The city cohort covers 43 states and every Census region.
These geographic summaries report the median of city-level medians across the same 327-city launch cohort. Site-observation counts can include one domain in more than one city, so they are not presented as unique-domain totals.
Northeast
24 cities · median city LCP
Midwest
45 cities · median city LCP
South
134 cities · median city LCP
West
124 cities · median city LCP
View all 43 state summaries
| State | Cities | Site observations | Median city LCP | Median city score | Median city contact-form gap |
|---|---|---|---|---|---|
| AL | 6 | 209 | 8.0s | 61 | 60.6% |
| AR | 4 | 139 | 8.9s | 60 | 61.5% |
| AZ | 17 | 598 | 7.4s | 61 | 67.6% |
| CA | 47 | 2,095 | 7.5s | 62 | 65.1% |
| CO | 14 | 491 | 7.4s | 60 | 68.5% |
| CT | 6 | 209 | 7.9s | 63 | 57.8% |
| DE | 1 | 34 | 7.6s | 62 | 55.9% |
| FL | 33 | 1,503 | 7.9s | 60 | 61.1% |
| GA | 7 | 245 | 9.6s | 58 | 72.0% |
| IA | 3 | 106 | 8.8s | 64 | 69.4% |
| ID | 7 | 242 | 7.9s | 61 | 76.3% |
| IL | 3 | 105 | 8.0s | 59 | 70.0% |
| IN | 6 | 203 | 7.7s | 60 | 60.2% |
| KS | 3 | 150 | 9.1s | 61 | 61.1% |
| KY | 2 | 69 | 7.7s | 60 | 58.0% |
| LA | 1 | 56 | 7.4s | 61 | 73.2% |
| MA | 9 | 313 | 8.0s | 62 | 56.8% |
| MD | 2 | 70 | 9.0s | 61 | 71.2% |
| MI | 7 | 247 | 8.3s | 59 | 53.1% |
| MN | 8 | 312 | 9.0s | 58 | 66.7% |
| MO | 6 | 214 | 8.4s | 57 | 68.1% |
| MS | 2 | 66 | 7.6s | 63 | 69.7% |
| MT | 5 | 176 | 8.8s | 60 | 66.7% |
| NC | 14 | 523 | 7.8s | 60 | 63.9% |
| ND | 1 | 35 | 7.8s | 66 | 71.4% |
| NE | 1 | 31 | 8.4s | 58 | 61.3% |
| NJ | 3 | 113 | 7.7s | 62 | 60.5% |
| NM | 5 | 183 | 7.4s | 62 | 61.1% |
| NV | 2 | 75 | 7.5s | 61 | 62.9% |
| NY | 2 | 67 | 8.6s | 62 | 61.0% |
| OH | 3 | 95 | 8.2s | 58 | 60.0% |
| OK | 2 | 71 | 8.5s | 61 | 72.2% |
| OR | 5 | 209 | 9.5s | 64 | 69.2% |
| PA | 2 | 74 | 7.6s | 59 | 64.9% |
| RI | 2 | 103 | 9.1s | 60 | 66.7% |
| SC | 6 | 218 | 8.2s | 60 | 62.9% |
| SD | 1 | 35 | 9.6s | 59 | 74.3% |
| TN | 11 | 386 | 8.1s | 61 | 62.9% |
| TX | 40 | 2,039 | 8.1s | 60 | 64.8% |
| UT | 12 | 407 | 7.9s | 60 | 64.6% |
| VA | 3 | 102 | 7.2s | 64 | 61.3% |
| WA | 10 | 466 | 8.8s | 60 | 64.5% |
| WI | 3 | 104 | 7.5s | 59 | 63.9% |
Use the same instrument
Where does your website sit in the distribution?
Enter a public homepage. Routeless runs the same mobile PageSpeed and homepage checks, then places the result against this 11,432-domain snapshot.
Press and citation kit
Reuse the finding with the denominator attached.
The dataset and chart artwork are available under CC BY 4.0. Attribute Routeless, link to this report, and keep the collection date and valid denominator with any quoted figure.
Download
Full snapshot and tabular extract
JSON contains the complete snapshot. CSV provides flat national, platform, industry, region, and state metric rows for analysis.
Press-ready findings
- 95.4% of 11,184 completed mobile tests missed the 2.5-second LCP benchmark. Finding 01
- 63.1% of 11,432 sampled homepages had no detectable contact form. Finding 02
- 29.6% of 11,432 sampled homepages had no detectable analytics tag. Finding 03
- 8.4% of 11,432 sampled homepages had detectable online booking. Finding 04
Suggested citation
Routeless LLC (2026)
Routeless. “State of Small Business Websites 2026.” Routeless Business Website Benchmark, revision 2, 2026-08-26. https://www.routeless.io/website-benchmarks
Include the collection window and metric denominator when quoting a figure. Do not restate an observational difference as proof of causation.
Embeddable chart artwork
You may reproduce or embed these SVG charts with the source line intact and a link to this report. Attribution is what we ask for; the link may carry whatever rel attributes your site applies.
Mobile LCP benchmark
<a href="https://www.routeless.io/website-benchmarks"><img src="https://www.routeless.io/website-benchmarks/charts/mobile-speed.svg" alt="Routeless mobile LCP benchmark"></a>Homepage signals
<a href="https://www.routeless.io/website-benchmarks"><img src="https://www.routeless.io/website-benchmarks/charts/homepage-signals.svg" alt="Routeless homepage signal benchmark"></a>
Methodology and limits
Every percentage keeps its denominator.
Routeless deduplicated audited business domains within the stated batch, keeping the newest completed audit per domain. Homepage signal rates use only sites with a successful homepage fetch. Performance metrics use only sites with a successful mobile PageSpeed run. Each rate includes its numerator and denominator; missing observations are not counted as failures.
- Edition2026 · revision 2
- Collection window2026-08-24–2026-08-25
- MeasurementHomepage scan + PageSpeed mobile lab
- Public filesJSON · CSV
- Publication modelImmutable dated snapshot
- Reuse licenseCC BY 4.0
The JSON file is the full snapshot, including distributions and cohort records. The CSV is a flat extract of national, platform, industry, regional, and state metrics, including performance and homepage signals. Use the numbered finding labels in the press kit when a published claim must remain tied to this revision.
Corrections policy
Report a reproducible data, labeling, or methodology error through the company contact page with the affected figure and source. Routeless does not overwrite a published snapshot silently. A material correction receives a new revision, dated correction note, regenerated downloads, and an explanation of whether the reported finding changed. Routine changes to a sampled website do not alter the historical observation.